An interactive Power BI report designed to help business leaders quickly understand key performance metrics, uncover trends, and make data-driven decisions with confidence.
💡 Value & Impact
- Enables leadership to monitor KPIs and performance at a glance, reducing time spent on manual reporting.
- Provides data transparency and self-service exploration to support faster, more informed strategic decisions.
- Translates complex data into clear, actionable visuals aligned with business goals.
🛠️ Tools & Techniques
- SQL Server (data staging) · Power BI (data modeling & visualization) · DAX (custom logic & KPIs)
🏗️ Implementation
- Simulated a corporate data environment by staging the Contoso dataset in SQL Server.
- Designed a robust star schema for optimized reporting and analytics.
- Created a highly interactive executive dashboard featuring dynamic KPIs, advanced filtering, and intuitive drill-throughs.
🚀 Key Highlights
- Measure selection buttons allow toggling between Sales, Cost, and Profit for instant focus shifts.
- Drill-through and tooltip pages deliver deeper context without cluttering the main view.
- Cross-filtering across visuals enables seamless exploration and discovery of insights.
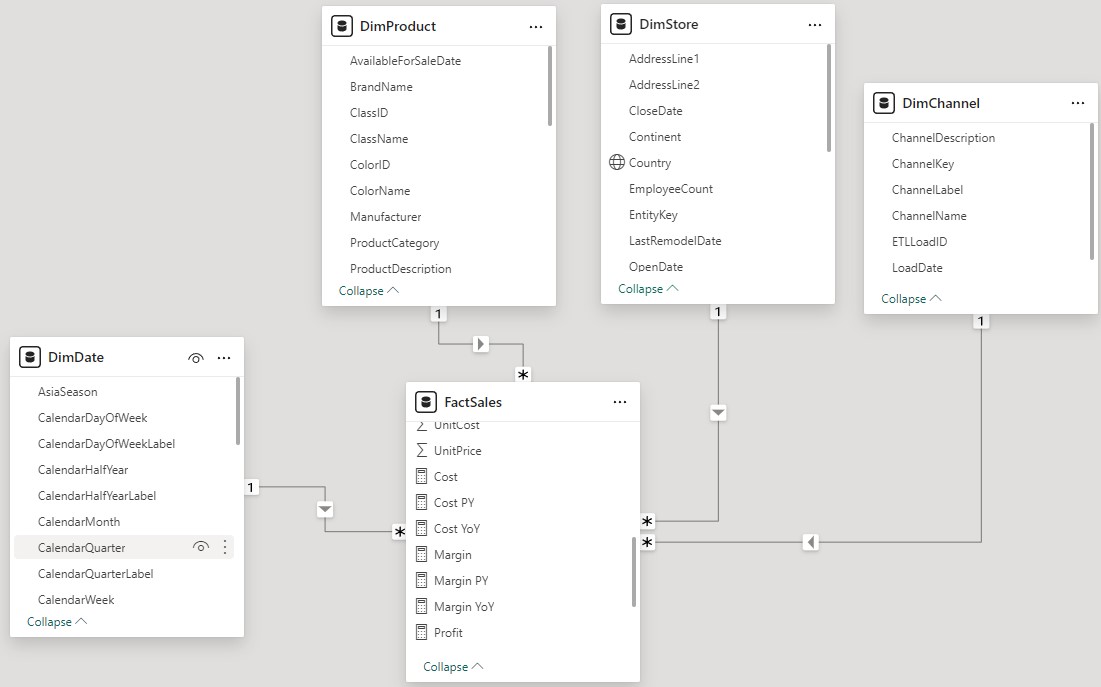 Screenshot of the Power BI data model