An interactive Power BI dashboard that transforms raw U.S. Census data into actionable insights on household income trends across the Dallas–Fort Worth area. The report enables users to explore demographics by geography, race, and income level — helping organizations and policymakers understand regional disparities and identify growth opportunities.
Behind the scenes, I built a scalable data pipeline that connects directly to the U.S. Census Bureau API, stages and transforms data with Python, and models it in a star schema optimized for analytics. I also integrated Census shapefiles and GeoJSON mapping for dynamic geographic visualization in Power BI.
🛠️ Tools & Techniques
- Python (
pandas&geopandas) • U.S. Census Bureau API • Star Schema Modeling • Power BI
💡 Value & Impact
- Designed a reusable data pipeline that automates Census data ingestion and transformation, enabling organizations to update demographic insights effortlessly.
- Structured the data into a clear, analysis-ready star schema, supporting fast and flexible reporting.
- Created a user-friendly Power BI interface that allows decision-makers to explore income and race distributions at the census-tract level.
- Demonstrates full-stack data capability, from API extraction and modeling to visualization, that can be adapted to other public or internal datasets for scalable business intelligence.
📁 Explore the Code
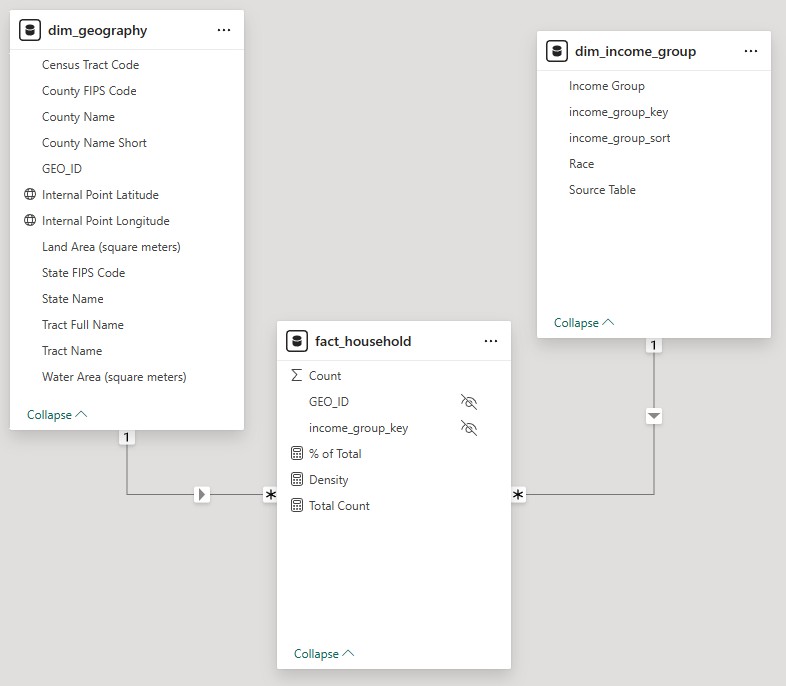 Screenshot of the Power BI data model